Analytics Dashboard for Construction: 1C, Sales & Site Progress
How developers and contractors in Uzbekistan can bring sales, 1C accounting, and actual construction progress onto a single screen, what it costs, and how it pays off.
To bring your construction sites, sales team, and 1C accounting onto a single screen, you don't need to spend hundreds of millions of UZS (so'm) on bulky ERP systems: a standard interactive analytics dashboard for a construction company can be launched in 3–4 weeks, with implementation costs in Tashkent ranging from 18,000,000 to 35,000,000 UZS (so'm), according to First Bit Uzbekistan. This solution replaces manual data gathering across scattered Excel files, links real on-site expenses with buyer payment schedules, and prevents cash flow shortages in real time.
Quick Take
- Uzbekistan's construction sector is booming: in January–September 2026, completed work totaled 339.3 trillion UZS (so'm), with 103.2 trillion in Tashkent alone, and small to mid-sized contractors handling 55% of the total volume, according to Stat.uz.
- A full license for "1C:ERP Construction Company Management" starts at 157,732,000 UZS (so'm) before setup costs, according to Leading.uz, which is often excessive for smaller property developers.
- Pairing a cloud BI tool with standard 1C and CRM costs between 18,000,000 and 35,000,000 UZS (so'm), delivering a quick return by keeping installment receivables in check and stopping material overruns on site.
- You can start with cloud BI platforms like Yandex DataLens, which offers a free community tier, while paid user seats cost around 135,000 UZS (so'm) per month, according to Yandex Cloud.
Why Standard Reports Fall Short for Construction Businesses
Here is a common scenario in property development: the sales team manages apartment reservations in one spreadsheet, site supervisors send work completion certificates via Telegram chats, and accountants record transactions in 1C. As a result, executives only see their true financial numbers two to three weeks late. If a contractor falls behind on concrete pouring or buyers delay their installment payments, leadership only finds out when there is already no cash left on site to pay for rebar.
An interactive dashboard pulls data from three core operational pillars: the job site (planned vs. actual construction progress), the sales office (apartment grid and deal pipeline), and financial records (bank accounts and cash flow). All information refreshes automatically, eliminating human error and endless spreadsheet reconciliations.
Analytics Implementation Options: Comparing Approaches
When selecting your tools, it is crucial to consider the size of your business and how mature your current bookkeeping processes are. Here is a breakdown of implementation costs and timelines across the Tashkent market:
| Solution | Implementation Cost | Timeline | Best For |
|---|---|---|---|
| Heavy ERP (1C:ERP Construction Company Management) | From 157,732,000 UZS (so'm) (licenses) + implementation | 6–12 months | Large construction holdings with dozens of active sites and in-house analytics teams |
| Industry-Specific BI Dashboard over existing 1C and CRM | From 18,000,000 to 35,000,000 UZS (so'm) | 3–4 weeks | Small and medium developers or general contractors managing 1–3 active sites |
| Lightweight Cloud Dashboard (DataLens / Power BI) | From 135,000 UZS (so'm) per user seat/month + connector configuration | 2–3 weeks | Contractors looking to track planned vs. actual progress without deep custom software builds |
If you are just starting
If you are managing your first residential project or a few subcontracting jobs, do not attempt to build a complex, multi-tiered platform right away. Focus on establishing a reliable core tracking workflow:
- Identify 5–7 vital metrics: actual vs. planned volume of poured concrete or brickwork, available vs. reserved floor space, overdue balances on installment contracts, and available cash across bank accounts.
- Establish reliable source data entry: job supervisors should log physical build volumes weekly, while sales reps must update property statuses in a shared system the moment a deposit clears.
- Connect a lightweight BI solution. Using cloud platforms such as Yandex DataLens lets you get started on the free Community tier, only paying for extended user seats at 135,000 UZS (so'm) per month, according to Yandex Cloud.
We set up this foundational stack for smaller projects in just 2–3 weeks, streamlining data collection through custom CRM development and implementation without spending heavily on dedicated server infrastructure.
If your business is already running
For established developers running multiple active projects, the primary challenge is connecting fragmented databases without disruption. To transition operations to interactive dashboards without halting construction or sales, we suggest following these steps:
- Data Source Audit: Map out where off-plan sales contracts are stored, how construction estimates and completion certificates are logged into 1C, and which channels generate inbound buyer leads.
- Building a Data Warehouse (DWH): Build automated connectors linking your 1C database and CRM. Data is replicated into an analytical database (such as PostgreSQL or ClickHouse), so heavy executive reports never slow down day-to-day accounting work.
- Layering Dashboard Views: Create a dedicated CEO screen (net cash flow, project profit margins, overall construction velocity), a commercial director screen (m² sales velocity, average price per square meter, call-to-deal conversion), and a CFO screen (payment schedule, cash gap warnings).
- Team Training: Set clear cutoff deadlines for routine data entry so that the figures displayed on your dashboards remain accurate every single day.
Based on our client projects in Tashkent, integrating a BI system with several 1C databases and industry CRMs typically costs between 18,000,000 and 35,000,000 UZS (so'm), taking about one month from kickoff to launch.
A real case: End-to-End Tracking in Real Estate Development
Major Tashkent developer Golden House, with over 1 million m² of completed residential space, faced major bottlenecks managing sales and construction milestones across disconnected spreadsheets and generic software. This caused delays in executive reporting, raised the risk of double-booking units, and obscured installment payment collections. The company adopted the industry-tailored MacroCRM ecosystem alongside unified BI dashboards, connecting marketing campaigns, interactive sales grids, and real-time construction progress tracking, as reported by Spot.uz. As a result, leadership gained total visibility into projects from ground break to handover, shortened deal cycles, and eliminated manual spreadsheet reporting for top executives.
A real case from NDC: Transparent Operational Control
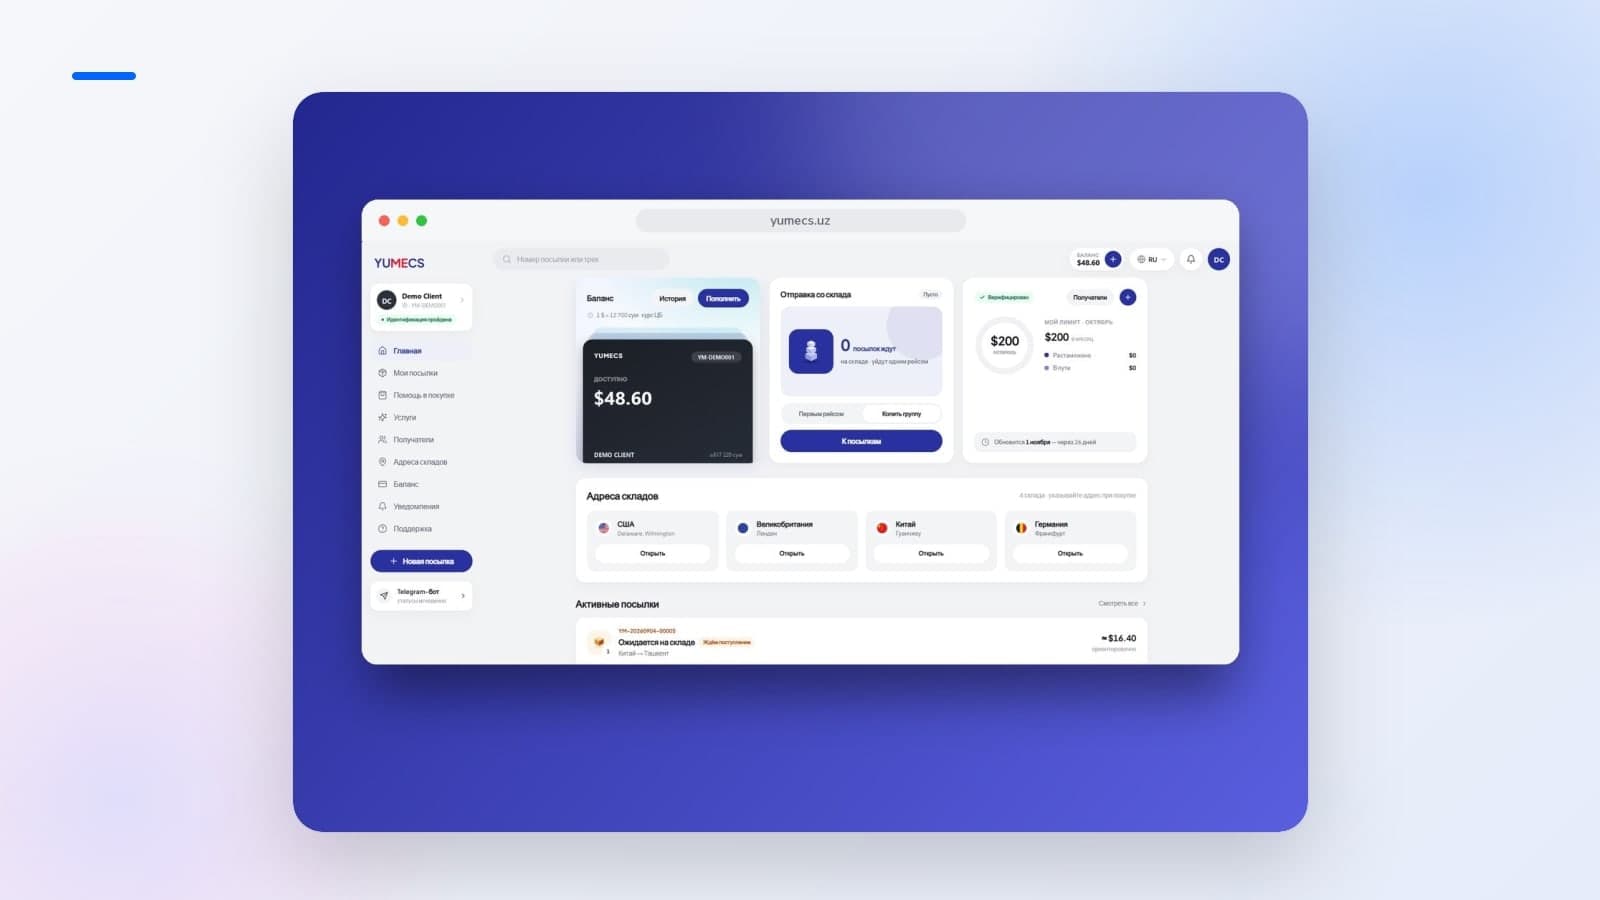
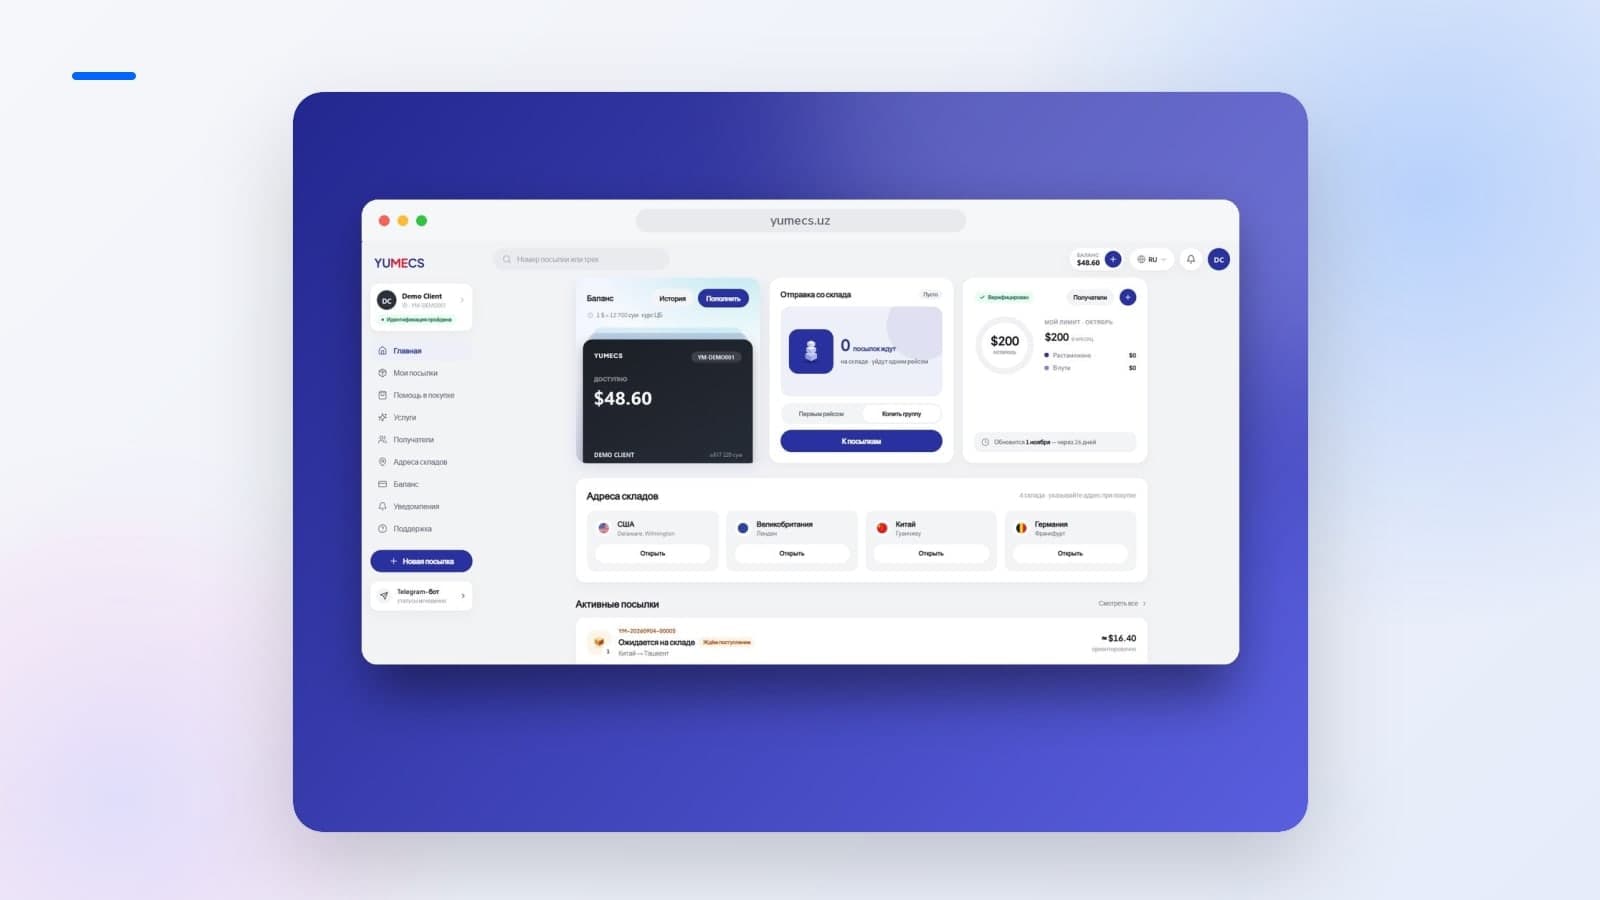
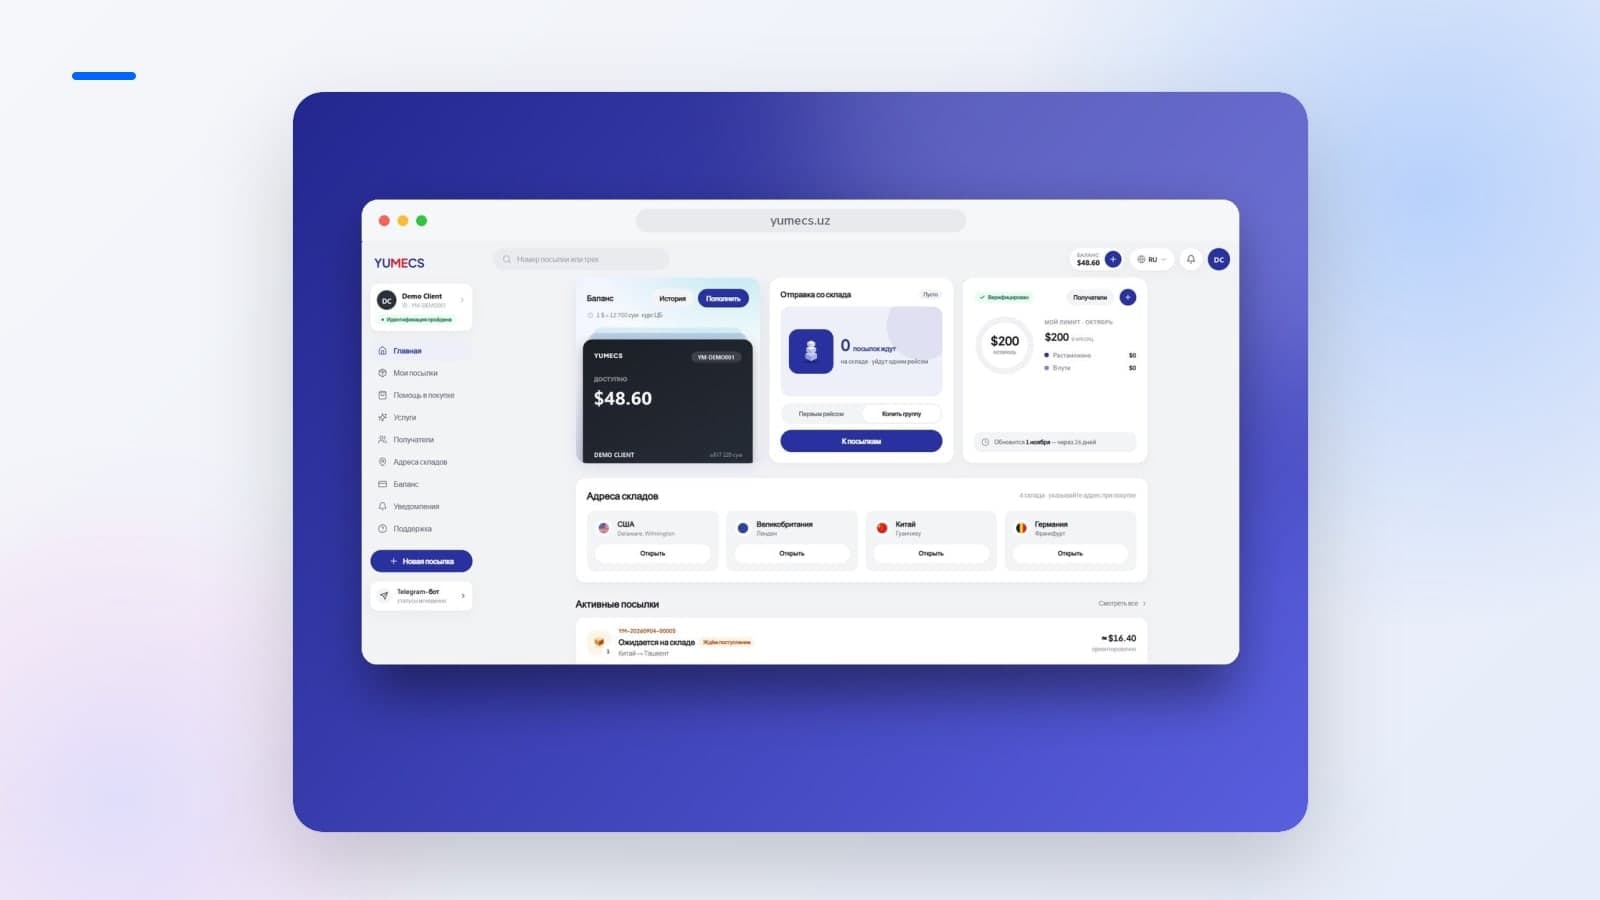
As a business scales, manual data entry and status updates inevitably fall apart. For logistics provider YUMECS, the NDC team developed a business automation system complete with an online client portal. Customers track their parcels, view their balances in USD based on official Central Bank exchange rates, and monitor customs limits, while instant delivery updates are sent via a Telegram bot. Automated workflows eliminated repetitive questions for staff, giving the company a unified operational tracking engine.
Common Pitfalls When Launching Construction Analytics
- Attempting to digitize chaos: If your job site lacks a clear sign-off process for completion certificates, or sales reps routinely forget to mark units as reserved, a dashboard will simply display bad data faster. Standardize your operational data-entry rules first.
- Overloading the primary view: Displaying the cost of every individual sack of plaster on the founder's executive screen creates unnecessary noise. Leadership needs to see schedule and budget variances at a glance; keep granular breakdowns nested inside deeper report layers.
- Overlooking mobile responsiveness: Managing partners and developers spend much of their time offsite or in meetings. Dashboards must render cleanly on smartphones and tablets. When required, we also provide mobile app development to deliver real-time operational insights wherever you are.
Frequently Asked Questions
How much does an analytics dashboard cost for a construction company in Tashkent?
A turnkey implementation of an executive management dashboard (tracking planned vs. actual construction milestones, installment cash flow, and unit reservations) in Uzbekistan ranges from 18,000,000 to 35,000,000 UZS (so'm), according to First Bit Uzbekistan. Cloud platform operating fees run around 135,000 UZS (so'm) per user per month, according to Yandex Cloud.
Can we skip buying an expensive 1C:ERP setup?
Yes. A standalone license for "1C:ERP Construction Company Management" costs from 157,732,000 UZS (so'm), according to Leading.uz. For small and medium-sized businesses, connecting a modern cloud BI tool to your existing 1C:Accounting and CRM setup is far more cost-effective, saving your budget and cutting deployment time down to 3–4 weeks.
How long does it take to build an analytics dashboard for a construction firm?
In our experience, developing and deploying a production-ready BI dashboard that connects managerial accounting and sales data for a construction company takes 3–4 weeks. This includes database integration, metric alignment, and hands-on staff training.
If you are ready to organize reporting across your job sites and eliminate messy spreadsheets, explore our recent work on our projects page or drop us a note through our contacts page — we will analyze your current workflows and suggest an actionable automation plan.
Sources
- Golden House · spot.uz
- Строительство в Республике Узбекистан за январь-сентябрь 2026 года — Stat.uz
- Комплексная автоматизация строительных организаций и решения 1С в Узбекистане — Leading.uz
- Отраслевые решения BI и 1С:Строительство в Ташкенте — Первый Бит Узбекистан
- Тарификация и возможности Yandex DataLens — Yandex Cloud